The aim is to let students work with a model rather than only read about it: move a shock or a parameter and see how the curves, the time paths and the numbers respond. Several use real Irish examples, from a multiplier calibrated to Ireland to the CSO’s input-output tables and Irish growth accounting. Each model builds up a stage at a time, with worked examples that set the sliders for you and tell you what to look at. Nothing is installed and nothing is sent anywhere: R itself is compiled to WebAssembly and runs on your own machine, inside the page. The first visit downloads it and takes a little under a minute; after that it starts in a second or two.
The IS-MP-PC Model
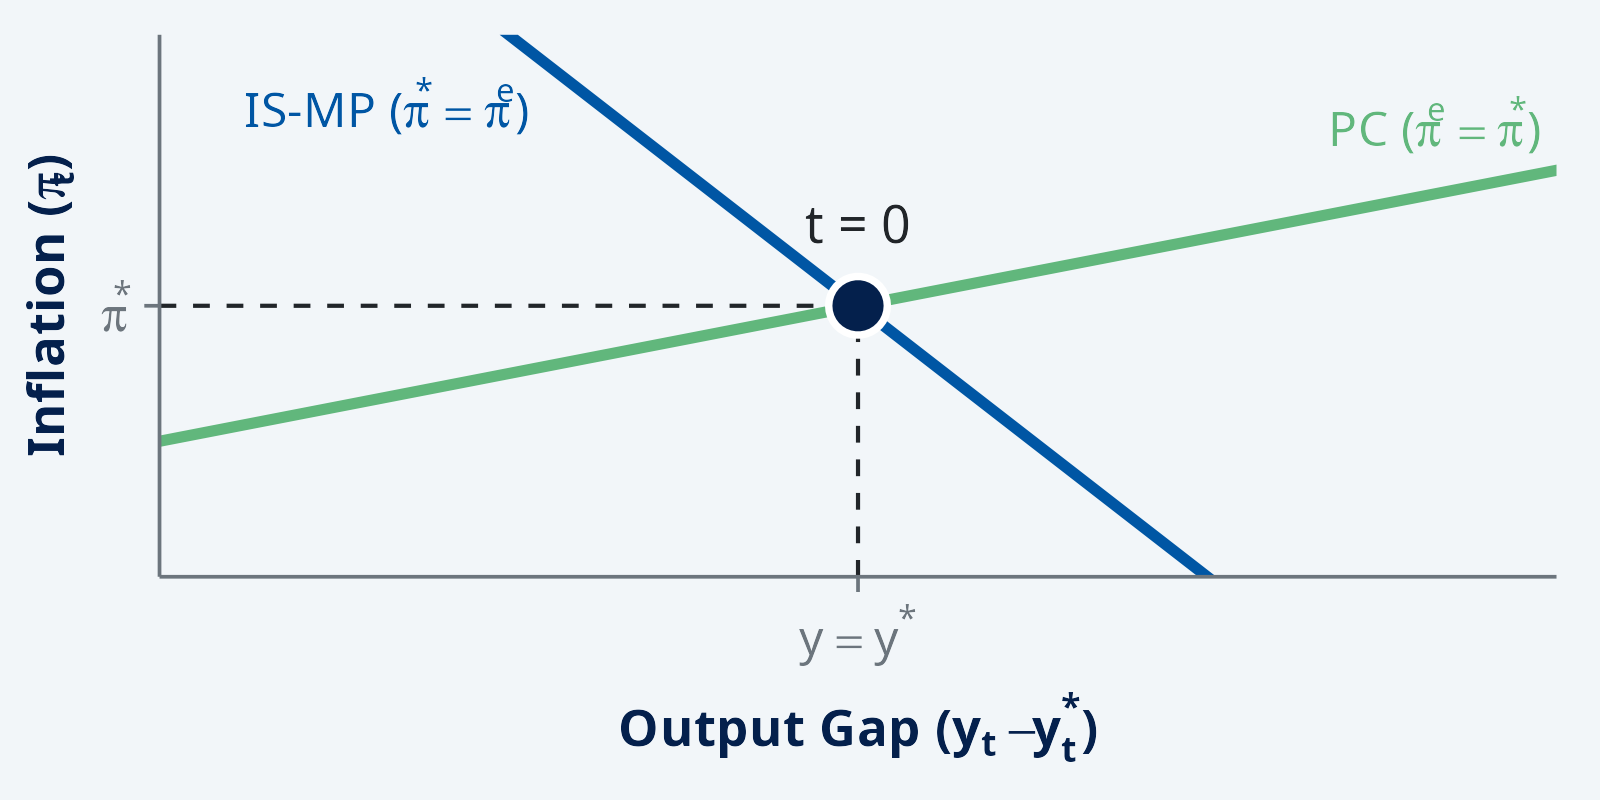
What a demand shock does to output and inflation, and how much of it a central bank can undo. Move a shock or a parameter and the curves, the time paths and the commentary all move together, so you can see which parameter rotates which curve and why.
The Keynesian Multiplier
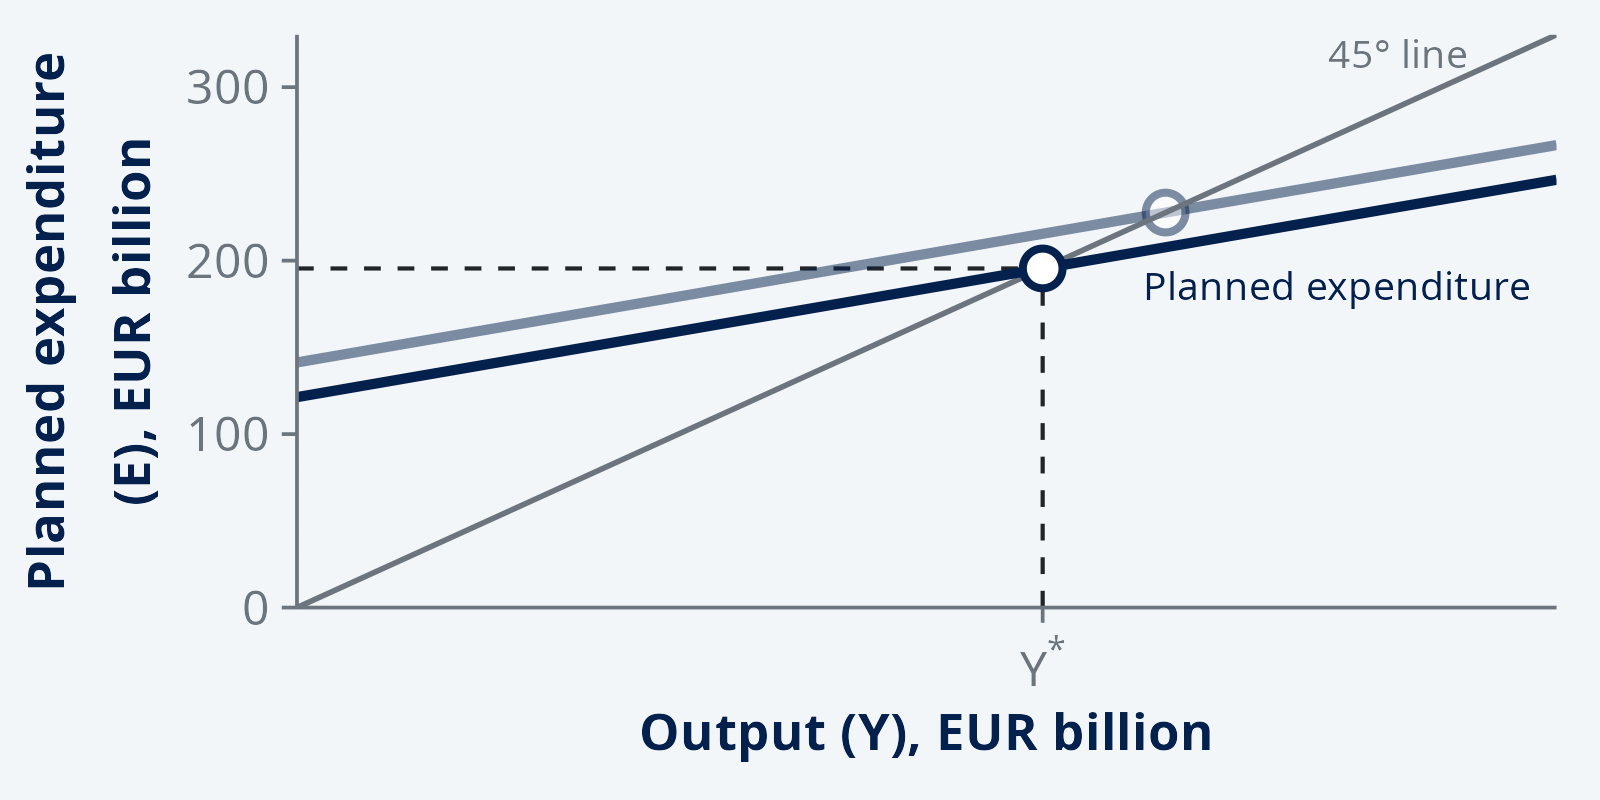
Spending becomes someone's income, which becomes spending again. Follow that round by round and watch what leaks out at each pass through taxes, saving and imports. Calibrated to Ireland in 2022, which the last stage reveals.
Input-Output Multipliers
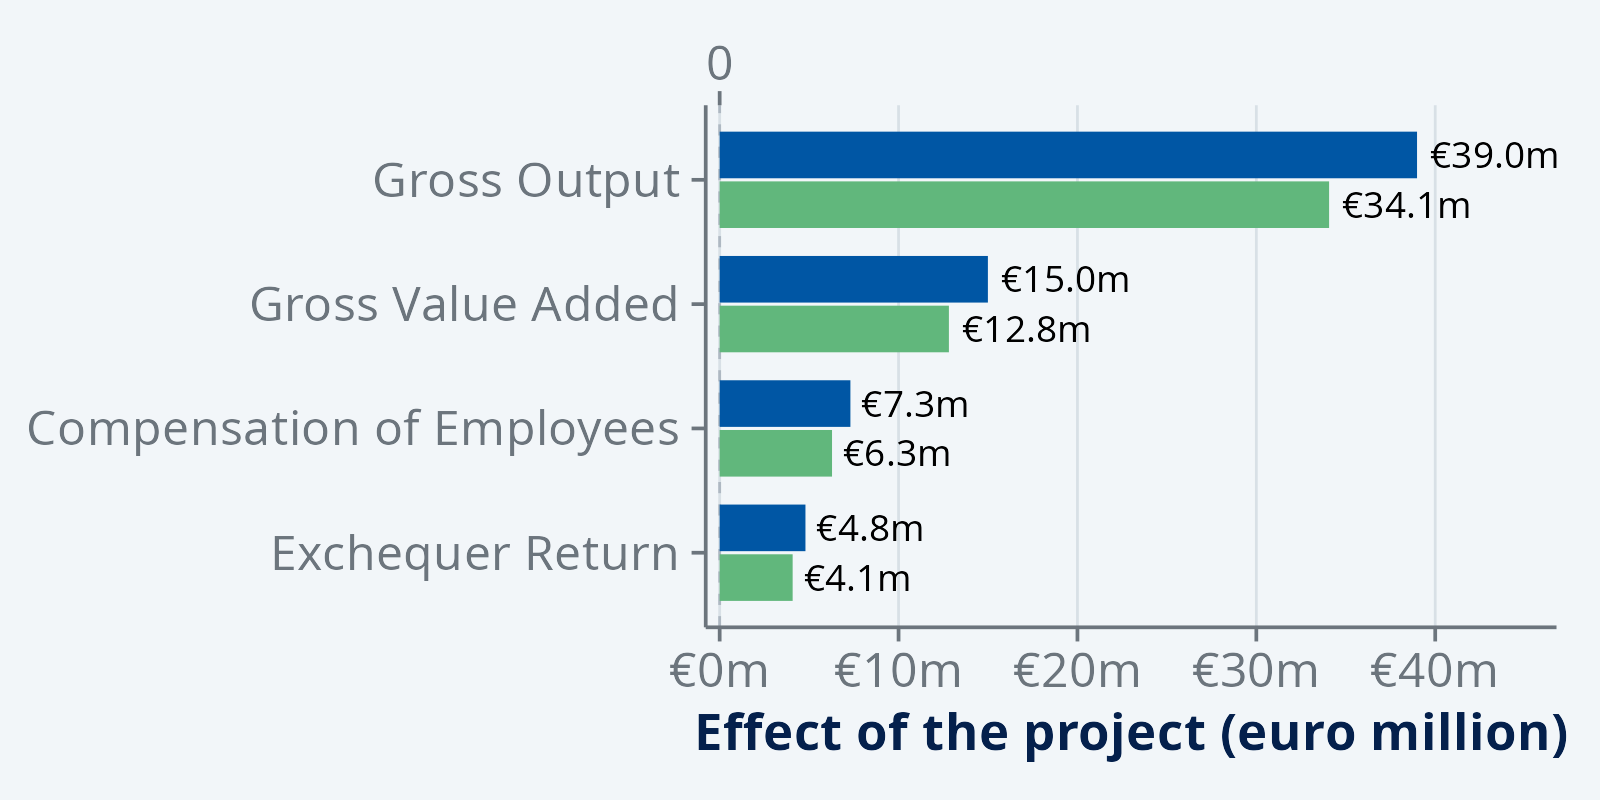
The multiplier again, but with a real economy behind it rather than one marginal propensity. Built on eight published CSO input-output tables, so you can see which sectors keep a euro at home and which send it straight abroad, and cost a project line by line.
Diamond and Dybvig
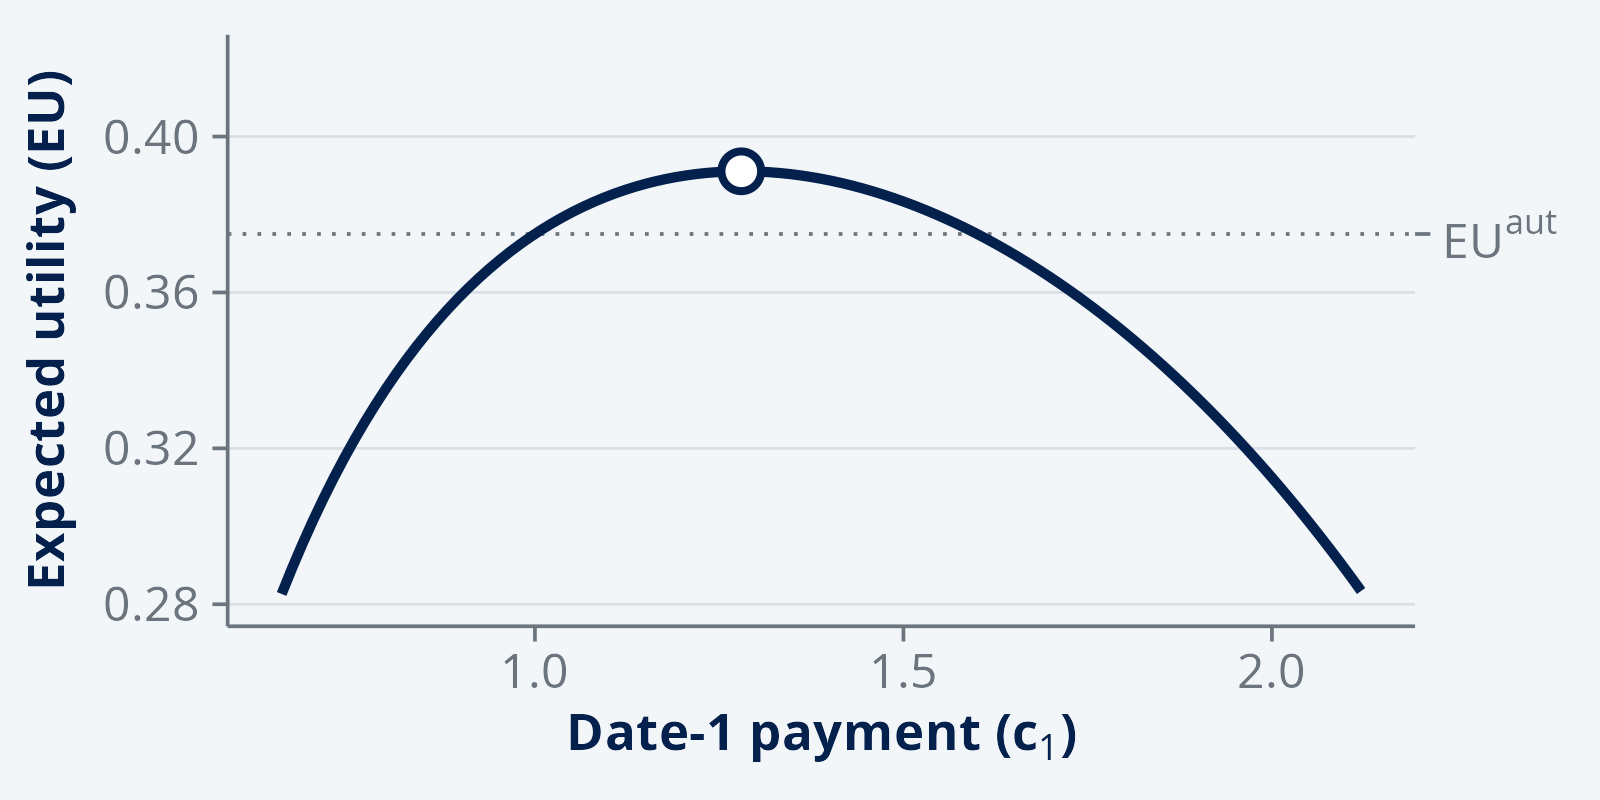
Banks turn illiquid assets into deposits people can withdraw on demand. That is valuable, and it is exactly what makes a run possible. Two equilibria sit in the same model, and which one you get depends on what everyone thinks everyone else will do.
Credit Rationing
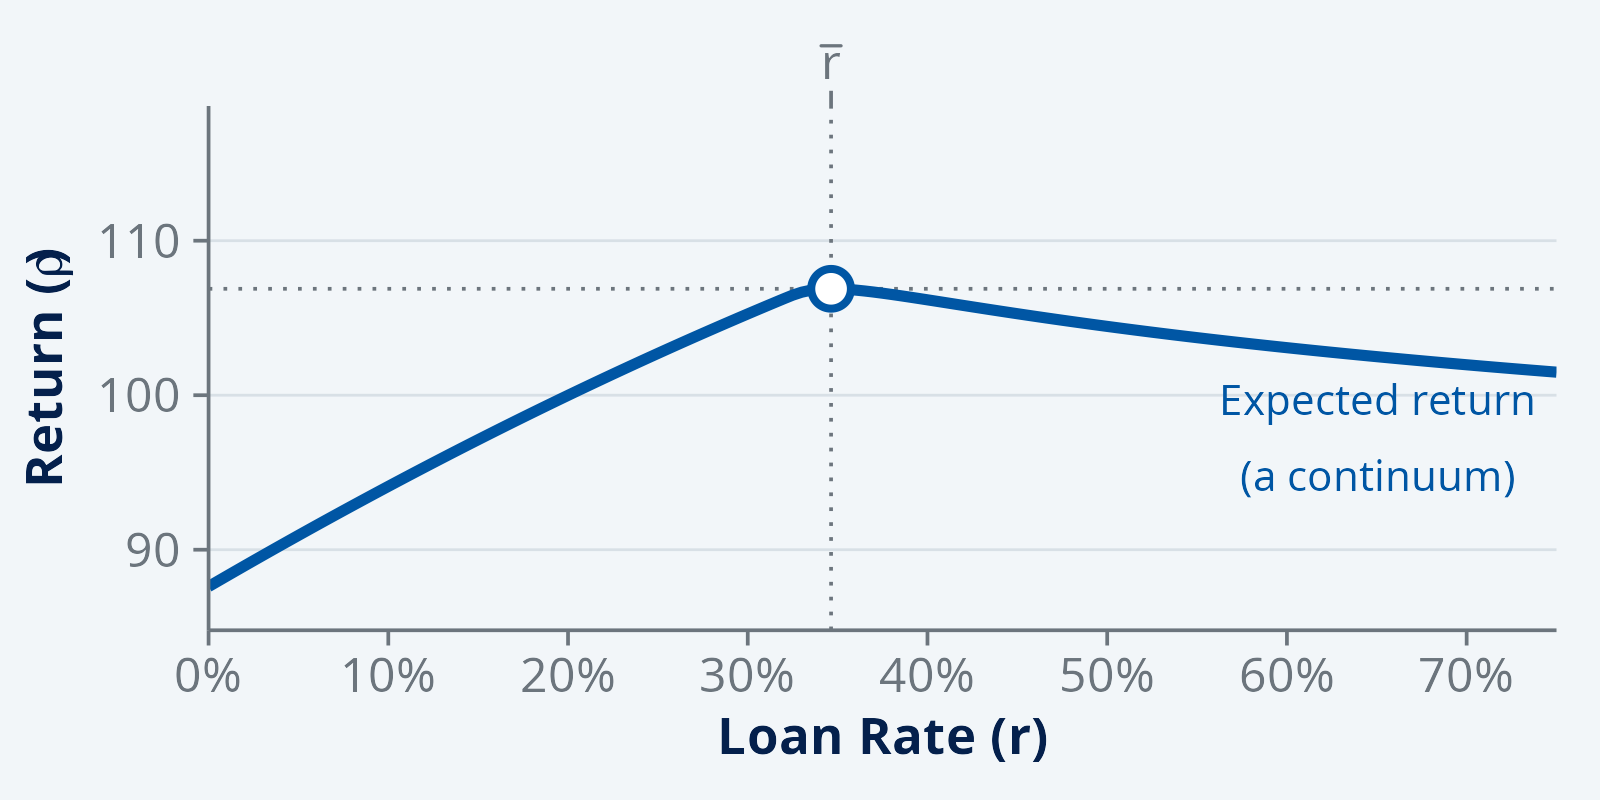
Raise the loan rate and the safer borrowers stop applying, so past a point a higher rate earns the bank less, not more. Follow Stiglitz and Weiss from the pricing of a single loan to a market where some borrowers are turned away at any rate, and then to what bank capital does to the tail.
Tobin's Q
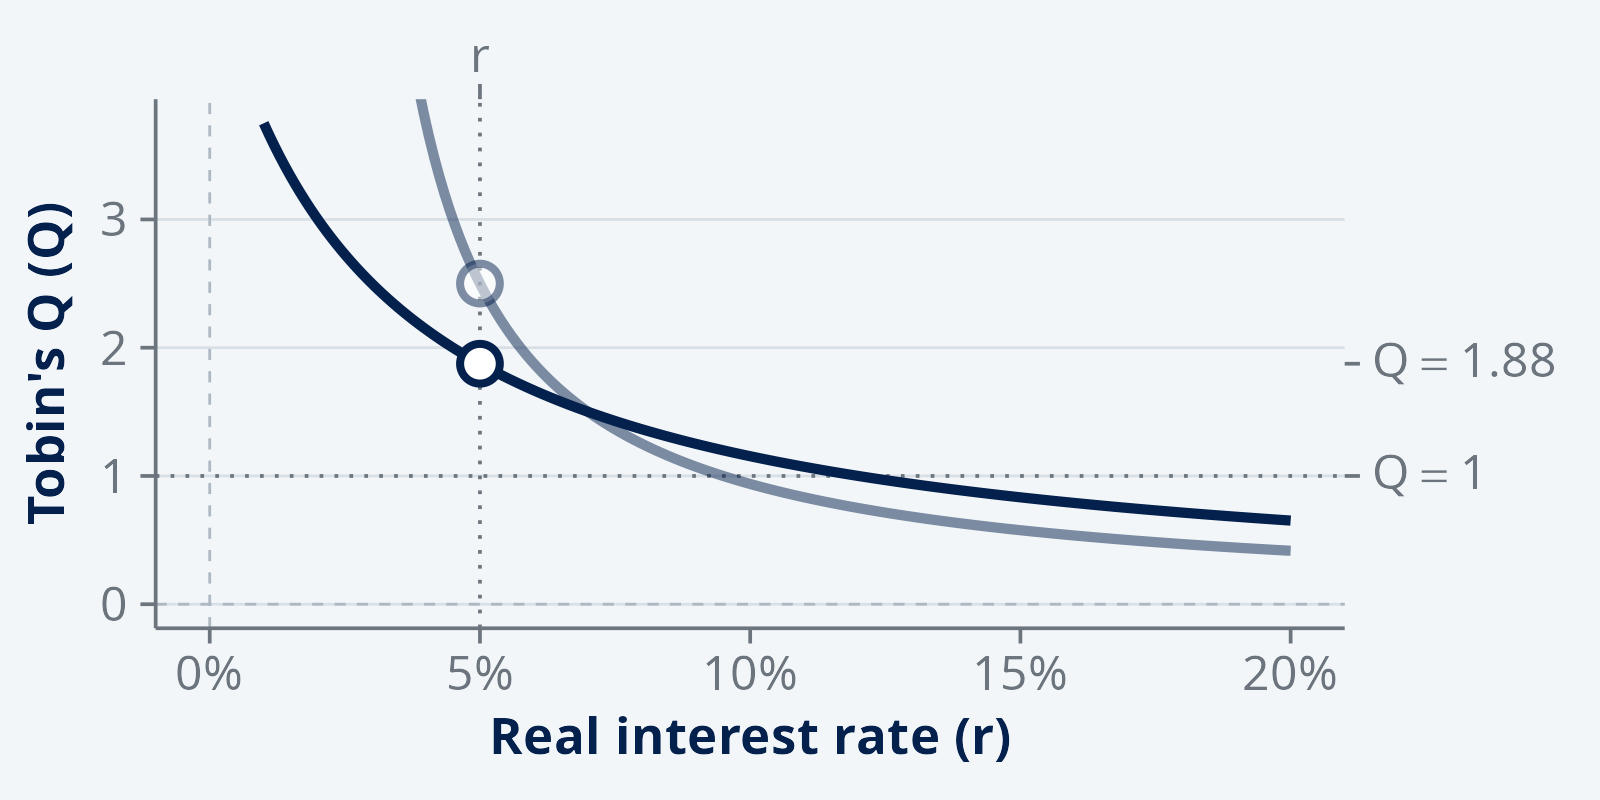
A firm invests when the market values a unit of capital above what it costs to install. That one ratio drives the whole investment decision — and then the data refuses to cooperate, which is the more interesting half of the story.
The Life-Cycle/Permanent-Income Hypothesis
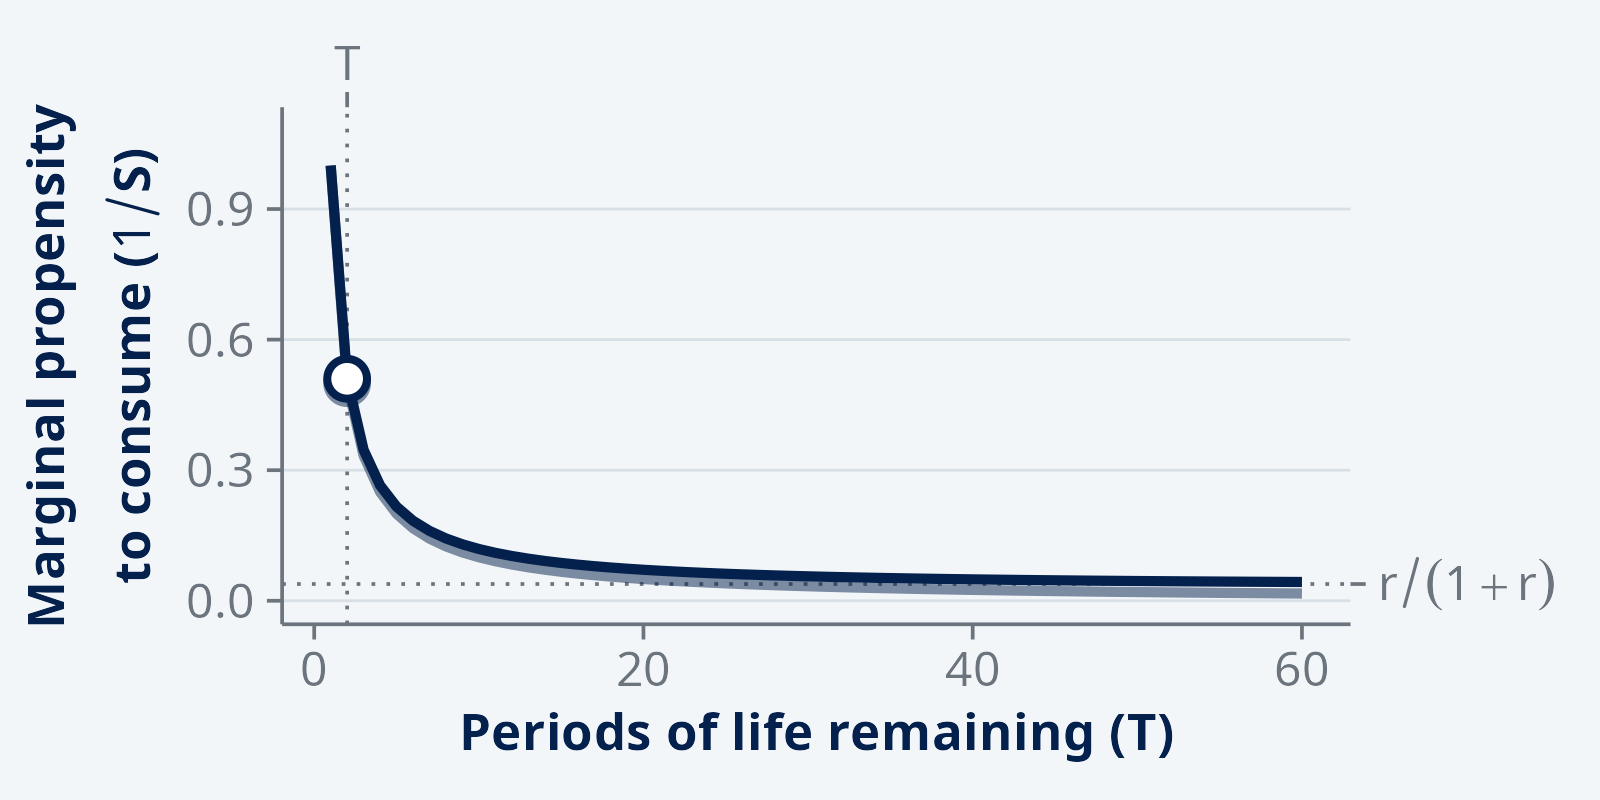
People consume out of what they expect to earn over a lifetime, not out of this month's pay. Follow that idea to its conclusions — consumption as a random walk, Ricardian equivalence, saving against uncertainty — and to the places it does not survive contact with the evidence.
Calvo Pricing and the NKPC
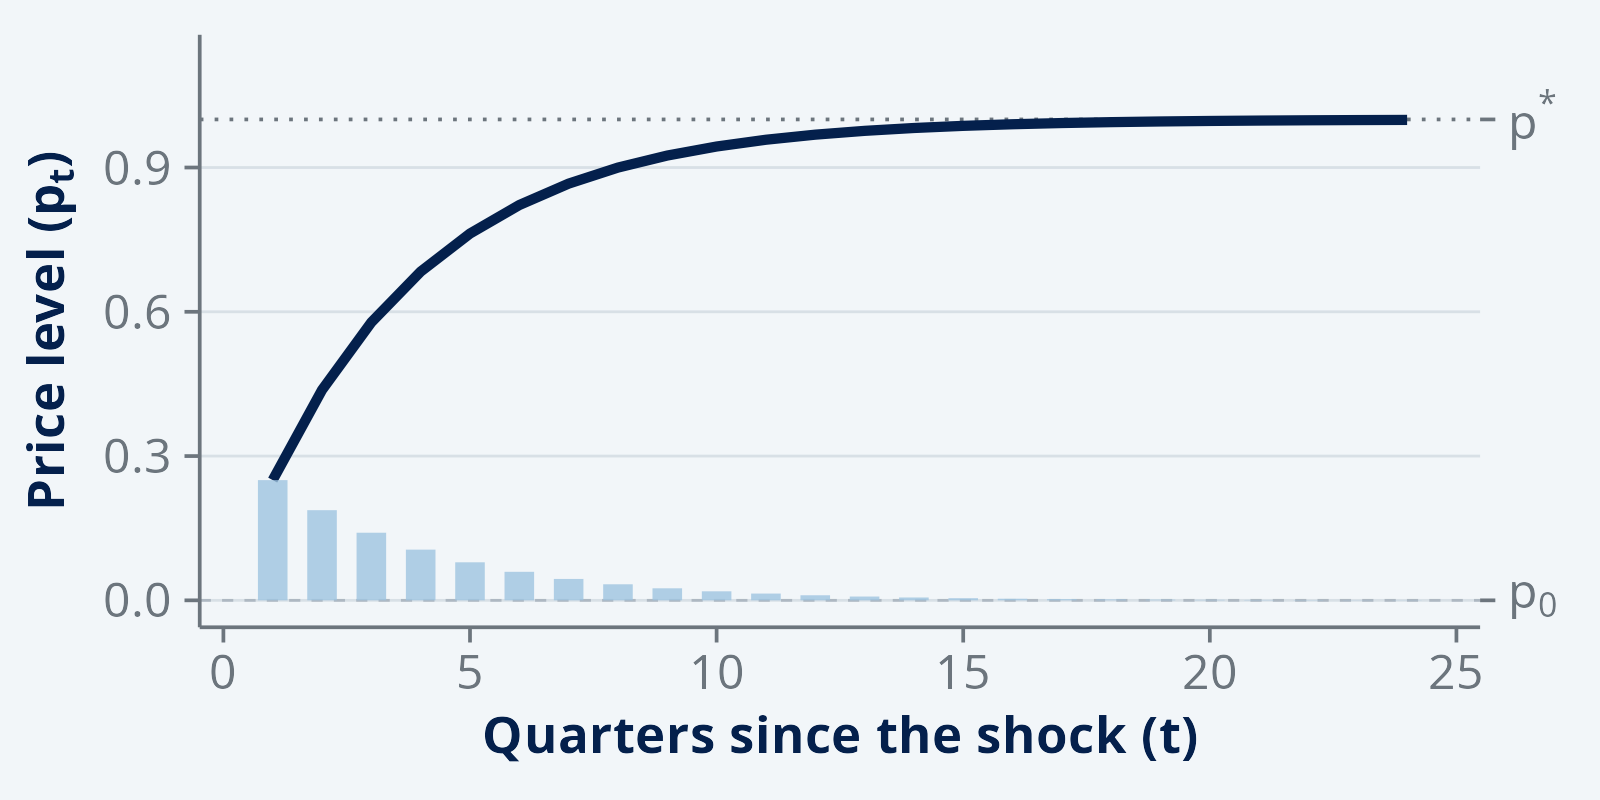
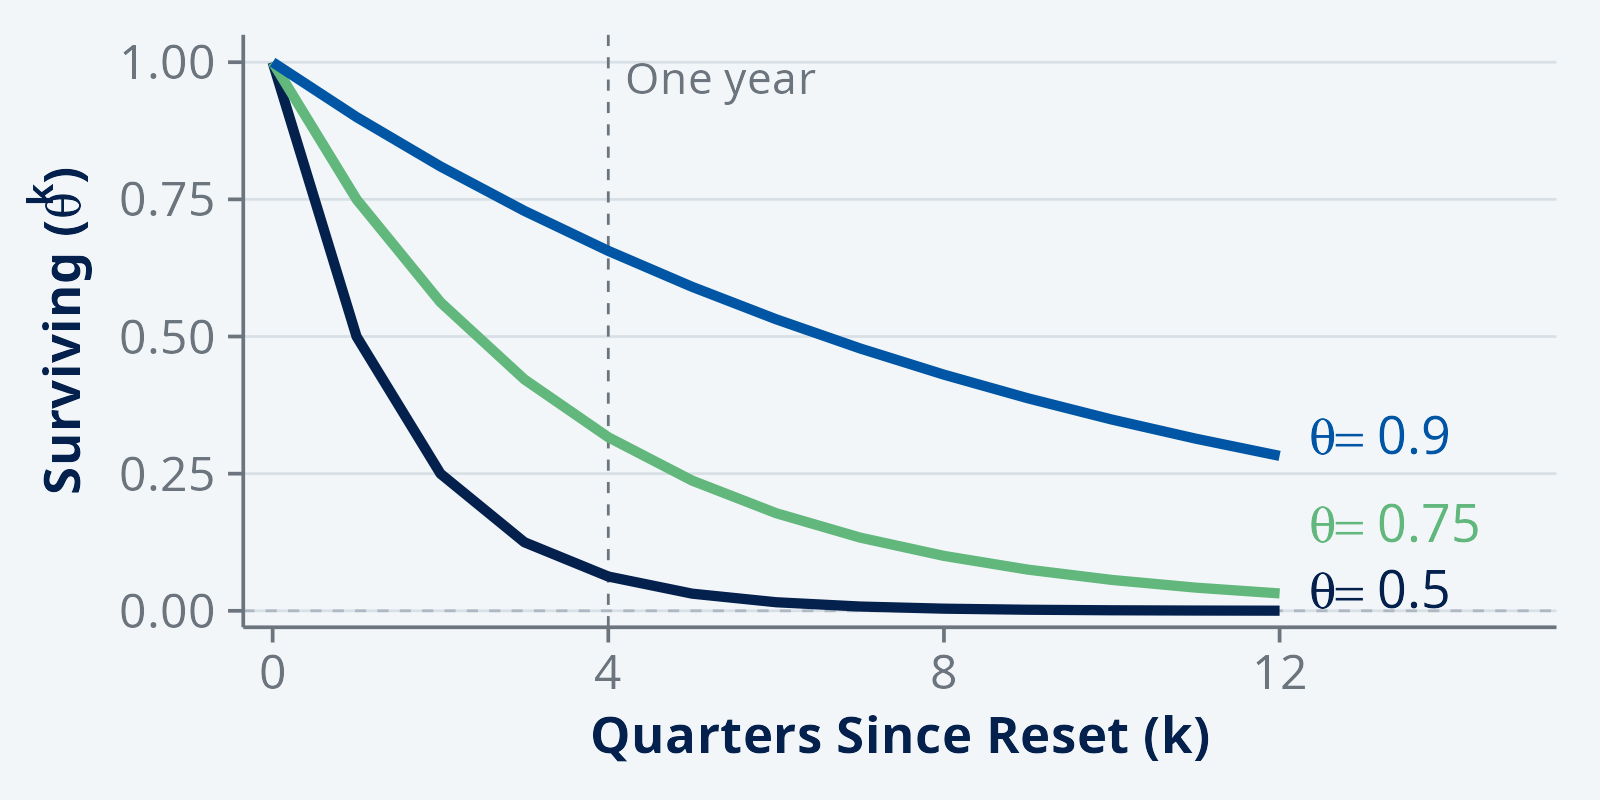
Only some firms can change price in any given month. Aggregate that one friction and a Phillips curve falls out, with a slope you can trace back to how long prices stay fixed — and a surprising claim about what it costs to bring inflation down.
The NKPC: Advanced
The graduate version of the Calvo model: one firm choosing a reset price, the price level that follows, and the New Keynesian Phillips curve that falls out. Then test it: what a credible disinflation costs, and how the implied price durations compare with the micro data.
The RBC Model
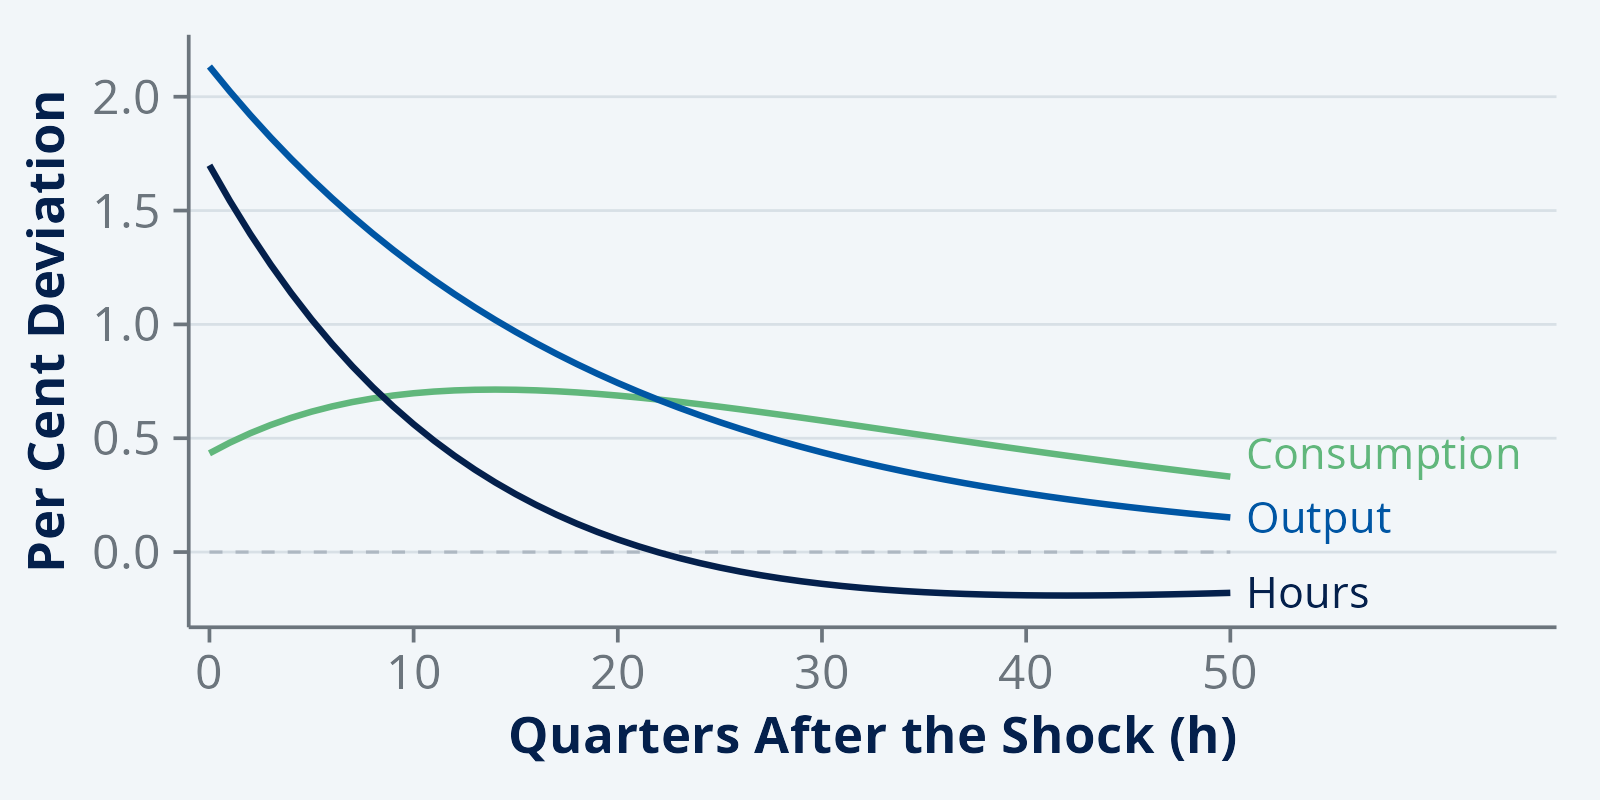
The methods half of the module in one model. Start with how long a shock lasts and which roots make a solution stable, then log-linearise the real business cycle model, simulate it and check it against the data, and finish by estimating it with priors and a posterior.
The Smets–Wouters Model
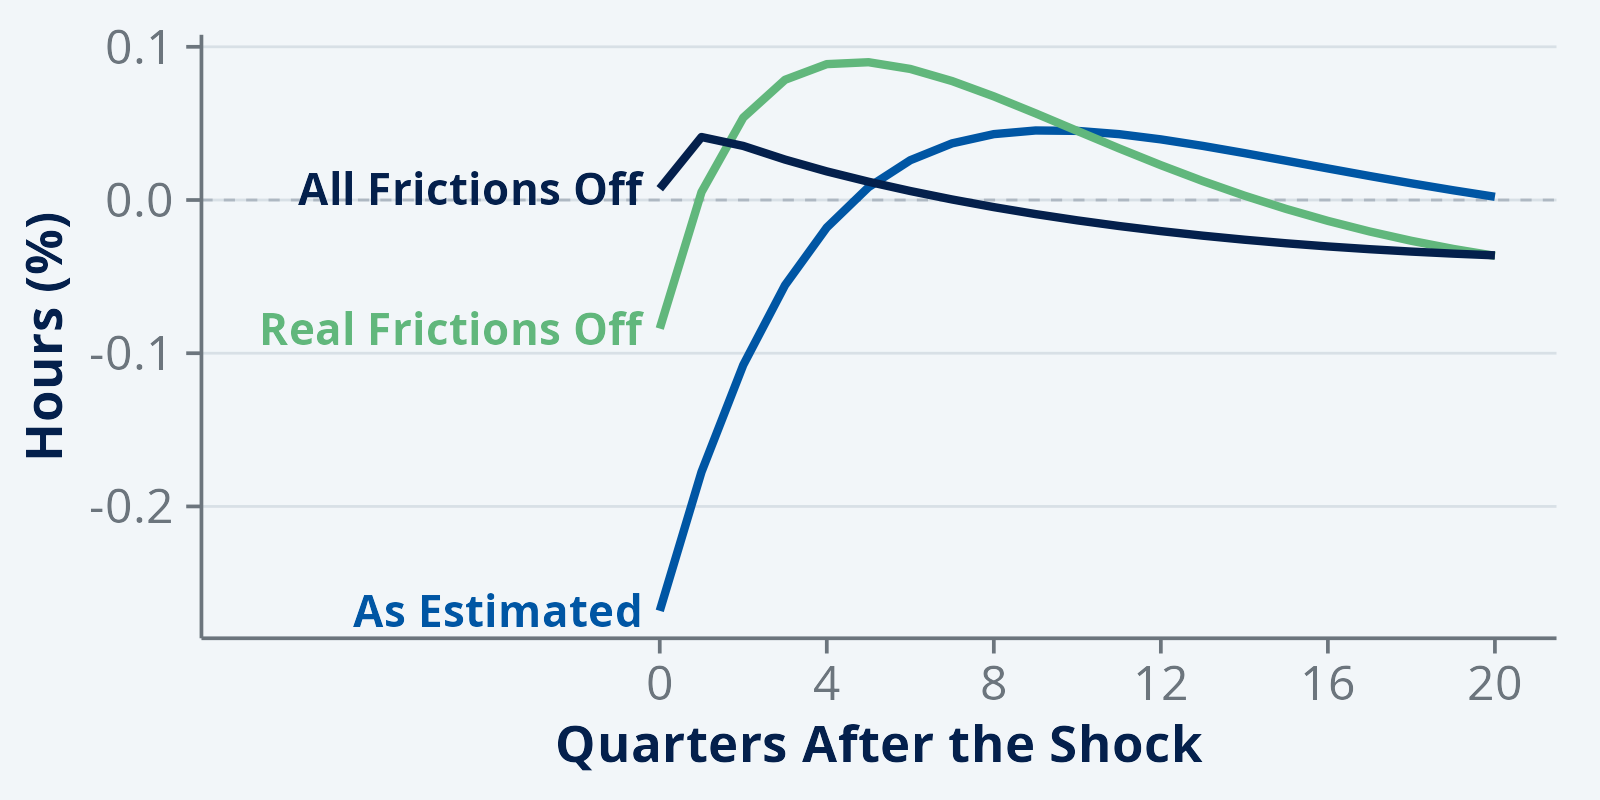
Seven frictions, seven shocks, estimated on US data. Switch the frictions off to see what each one buys, follow the responses to each shock, and decompose output and inflation into what drives them at each horizon. The last stage sets the lecture’s version beside Smets and Wouters’ own.
Latent Variables and the Kalman Filter
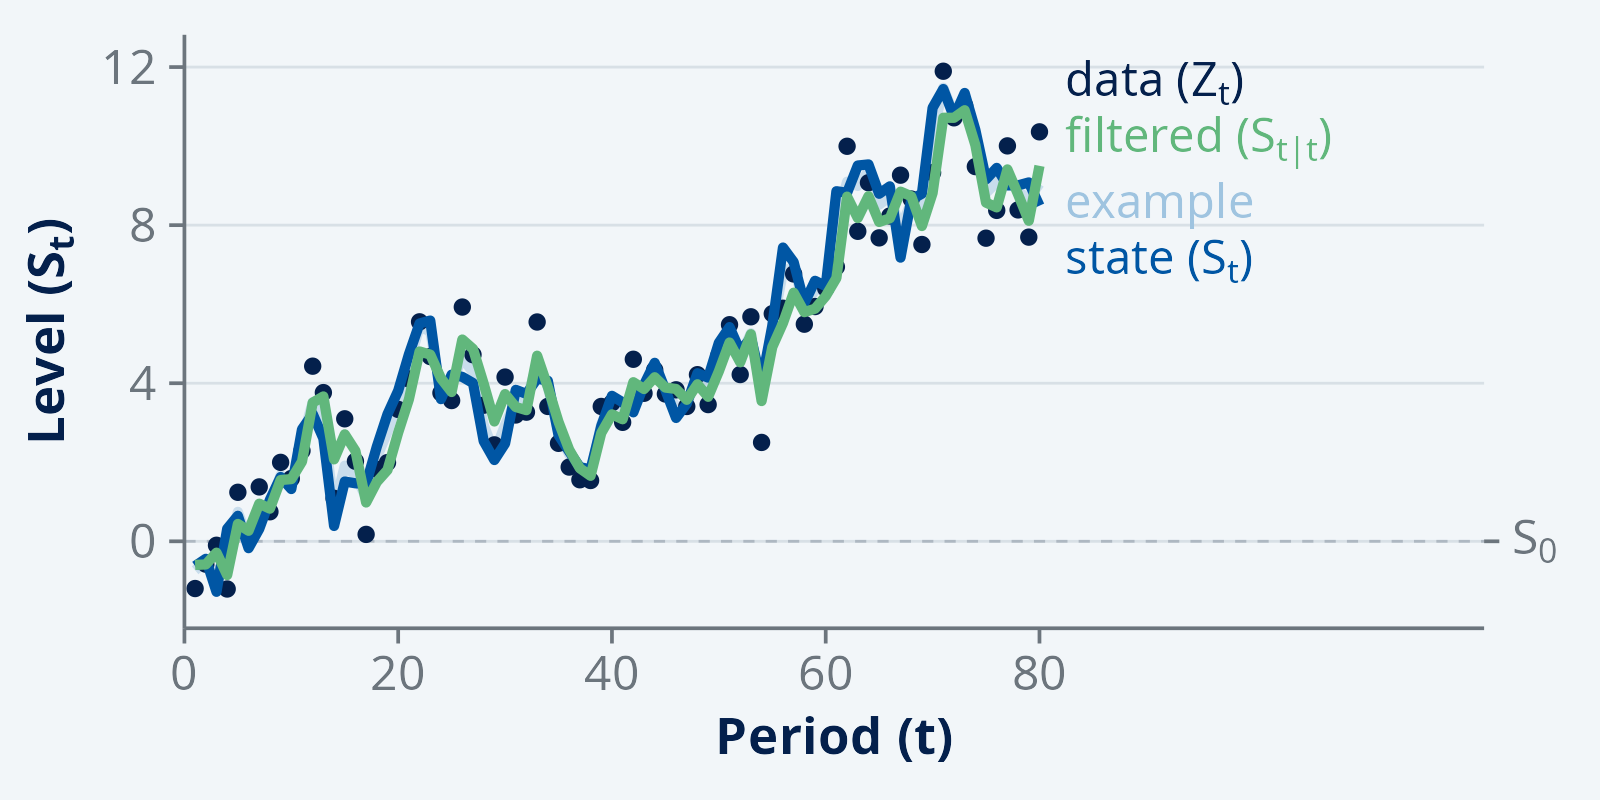
Trend growth, the output gap and the natural rate are never observed, only inferred. Watch the Kalman filter do the inferring: how much it trusts each new observation, why the gain settles where it does, and what the smoother adds once the whole sample is in.
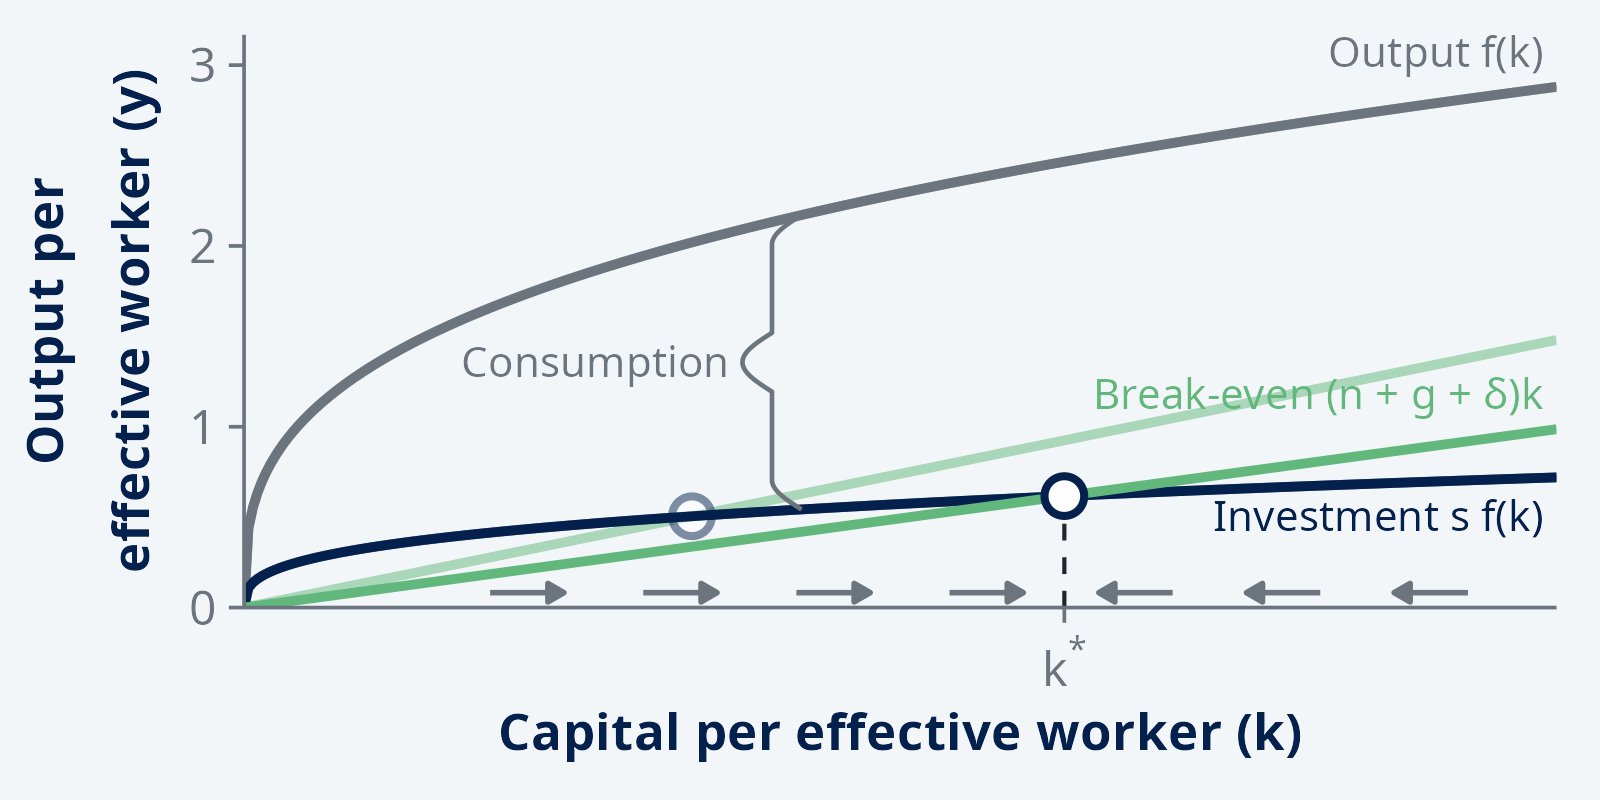
Growth Model: Solow “Capital”
Save more and you end up richer, but not growing faster. Watch capital accumulate, run into diminishing returns and settle, and see why only technology delivers growth that lasts — which leaves the model explaining growth by something it does not explain.
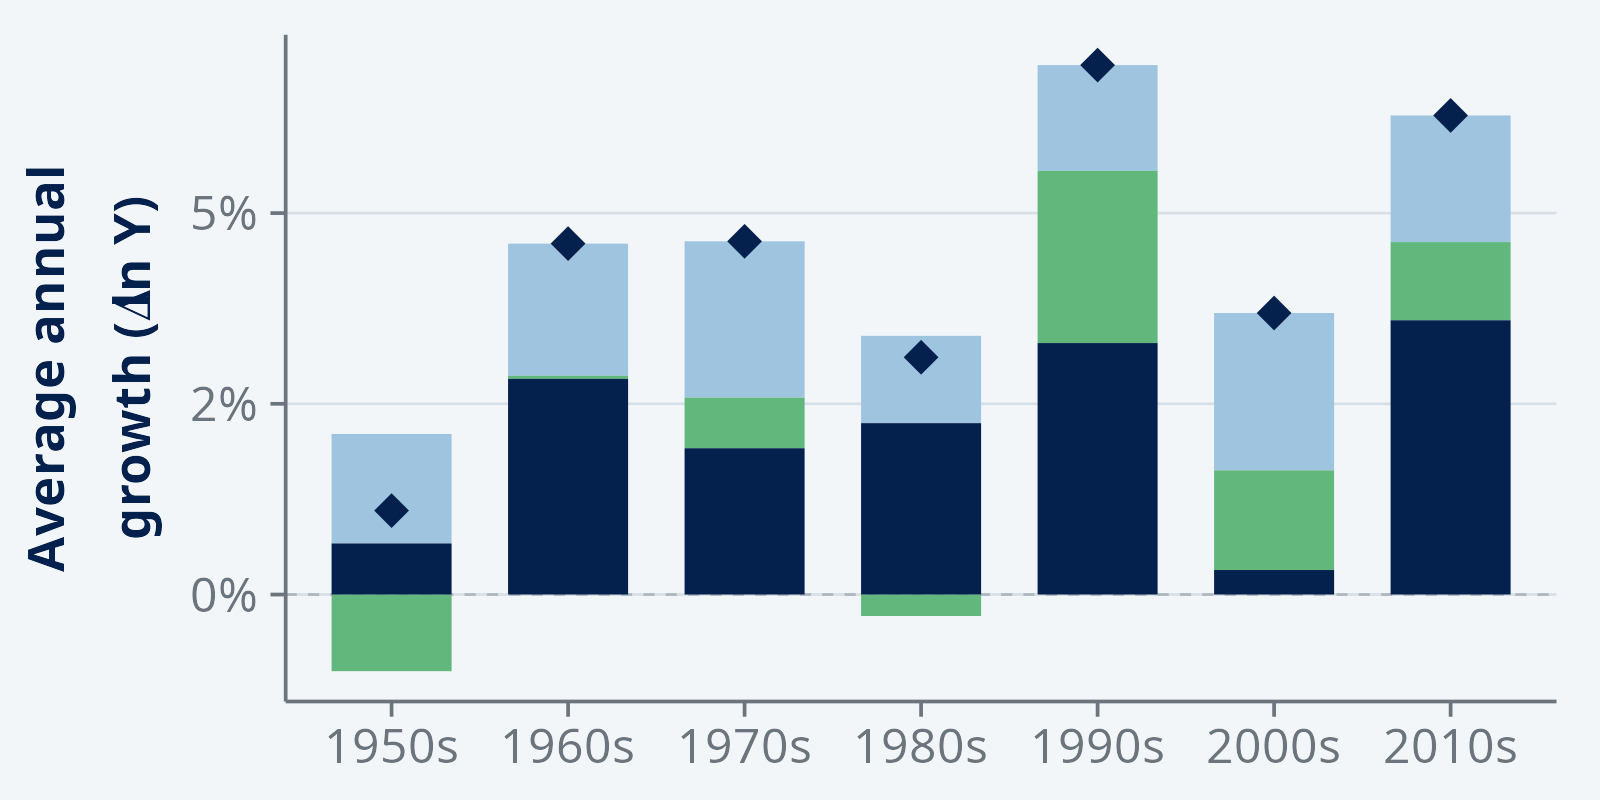
Growth Accounting
Take a country's growth apart into more capital, more workers, better workers, and whatever is left over. That residual is the biggest piece, and it is a measure of our ignorance as much as of technology.
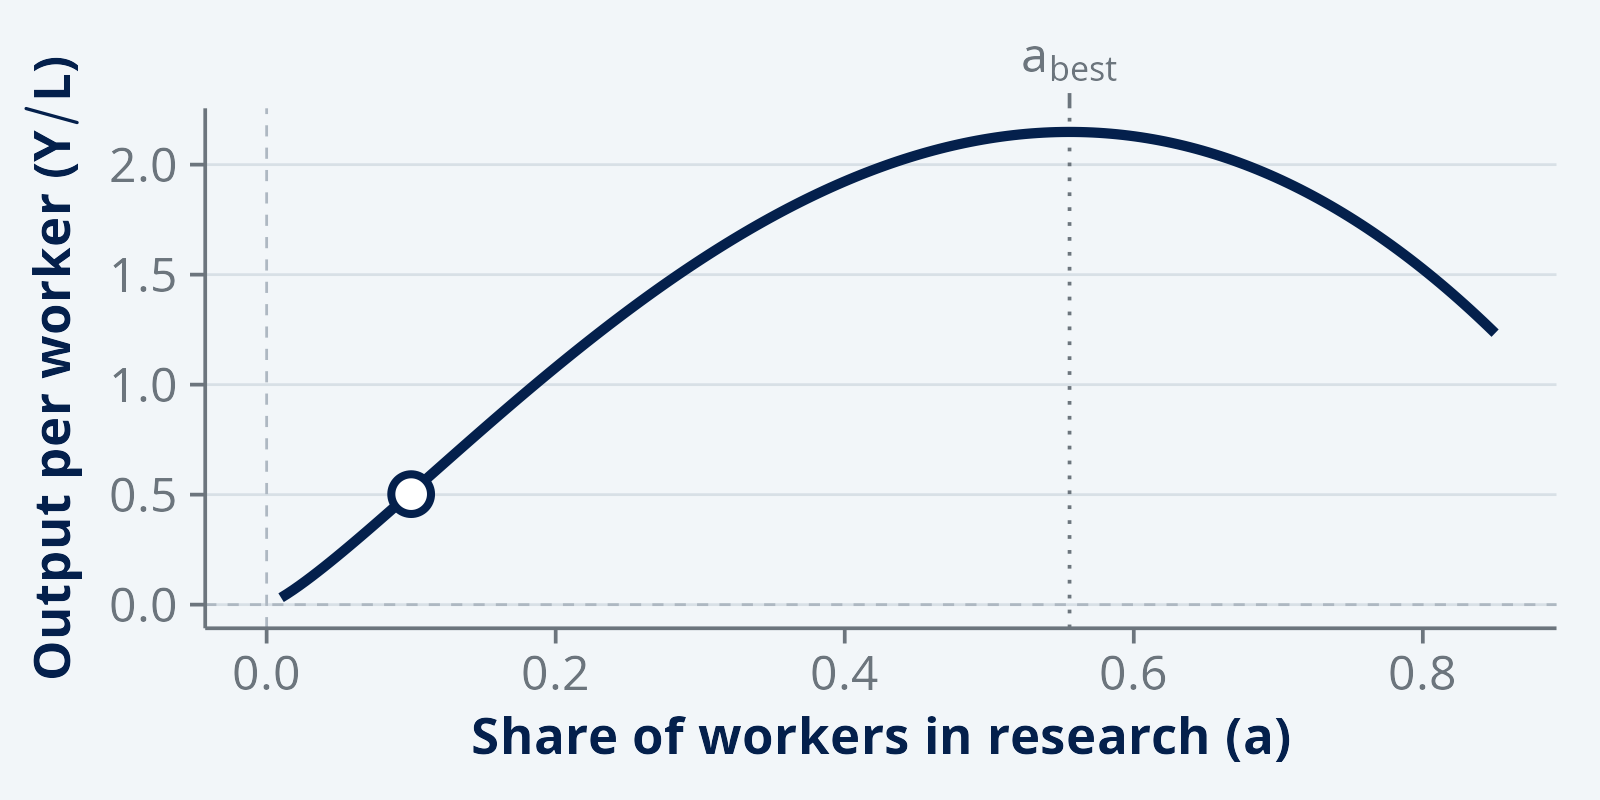
Growth Model: Romer “Endogenous”
Put research in the model and technology stops being a black box. Whether growth is something policy can raise, or something that comes down to population in the end, turns on one parameter — and you can move it.
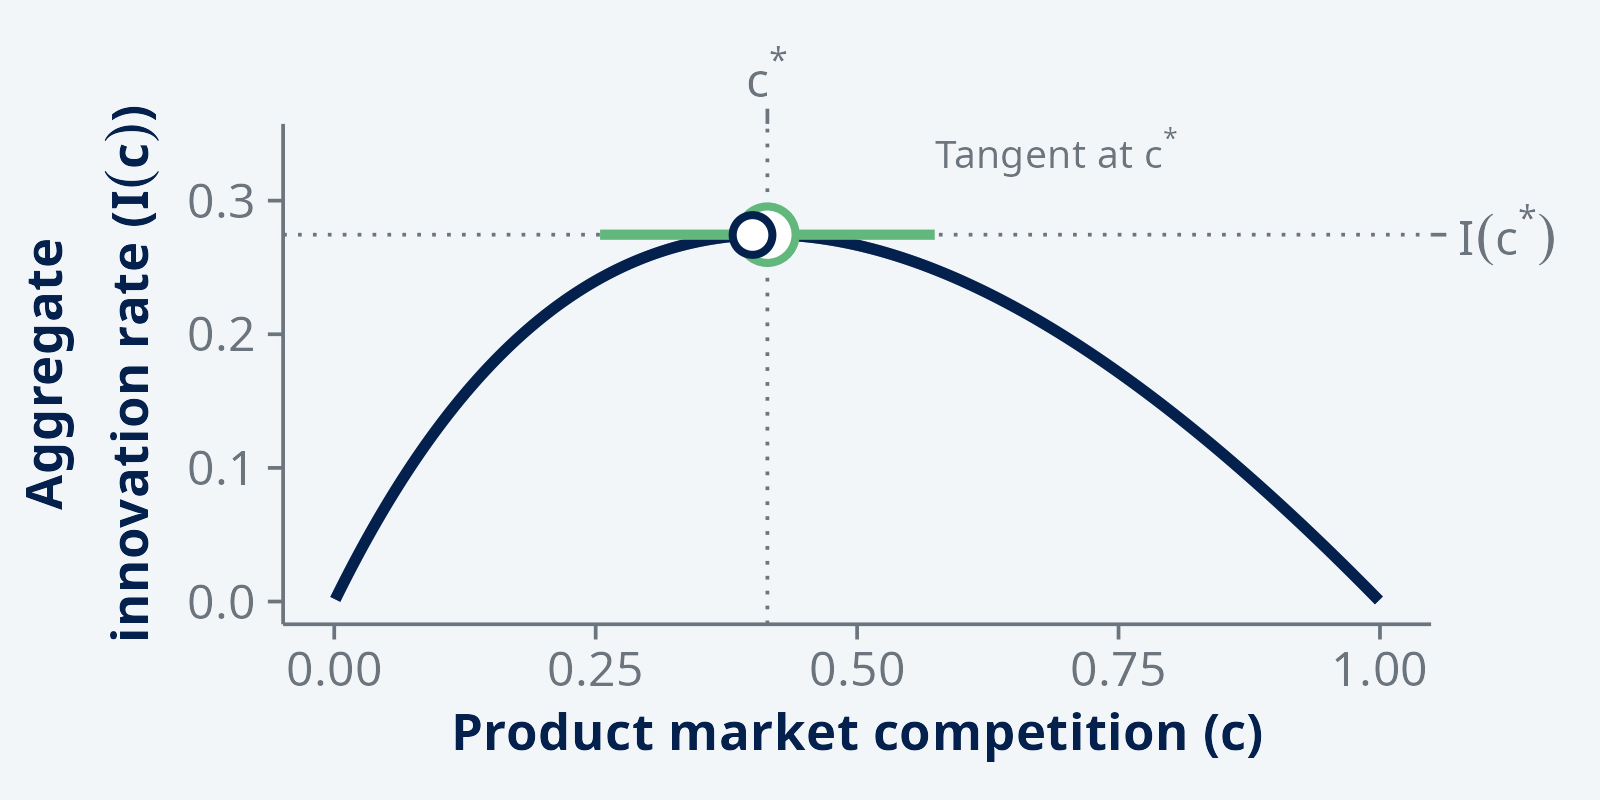
Growth Model: Schumpeterian “Destructive”
Firms innovate to escape their rivals, and stop bothering when the prize is gone. Those two forces pull opposite ways, and where they balance gives the inverted U between competition and innovation.